REVL Responsive Website

  • YuTing Cheng
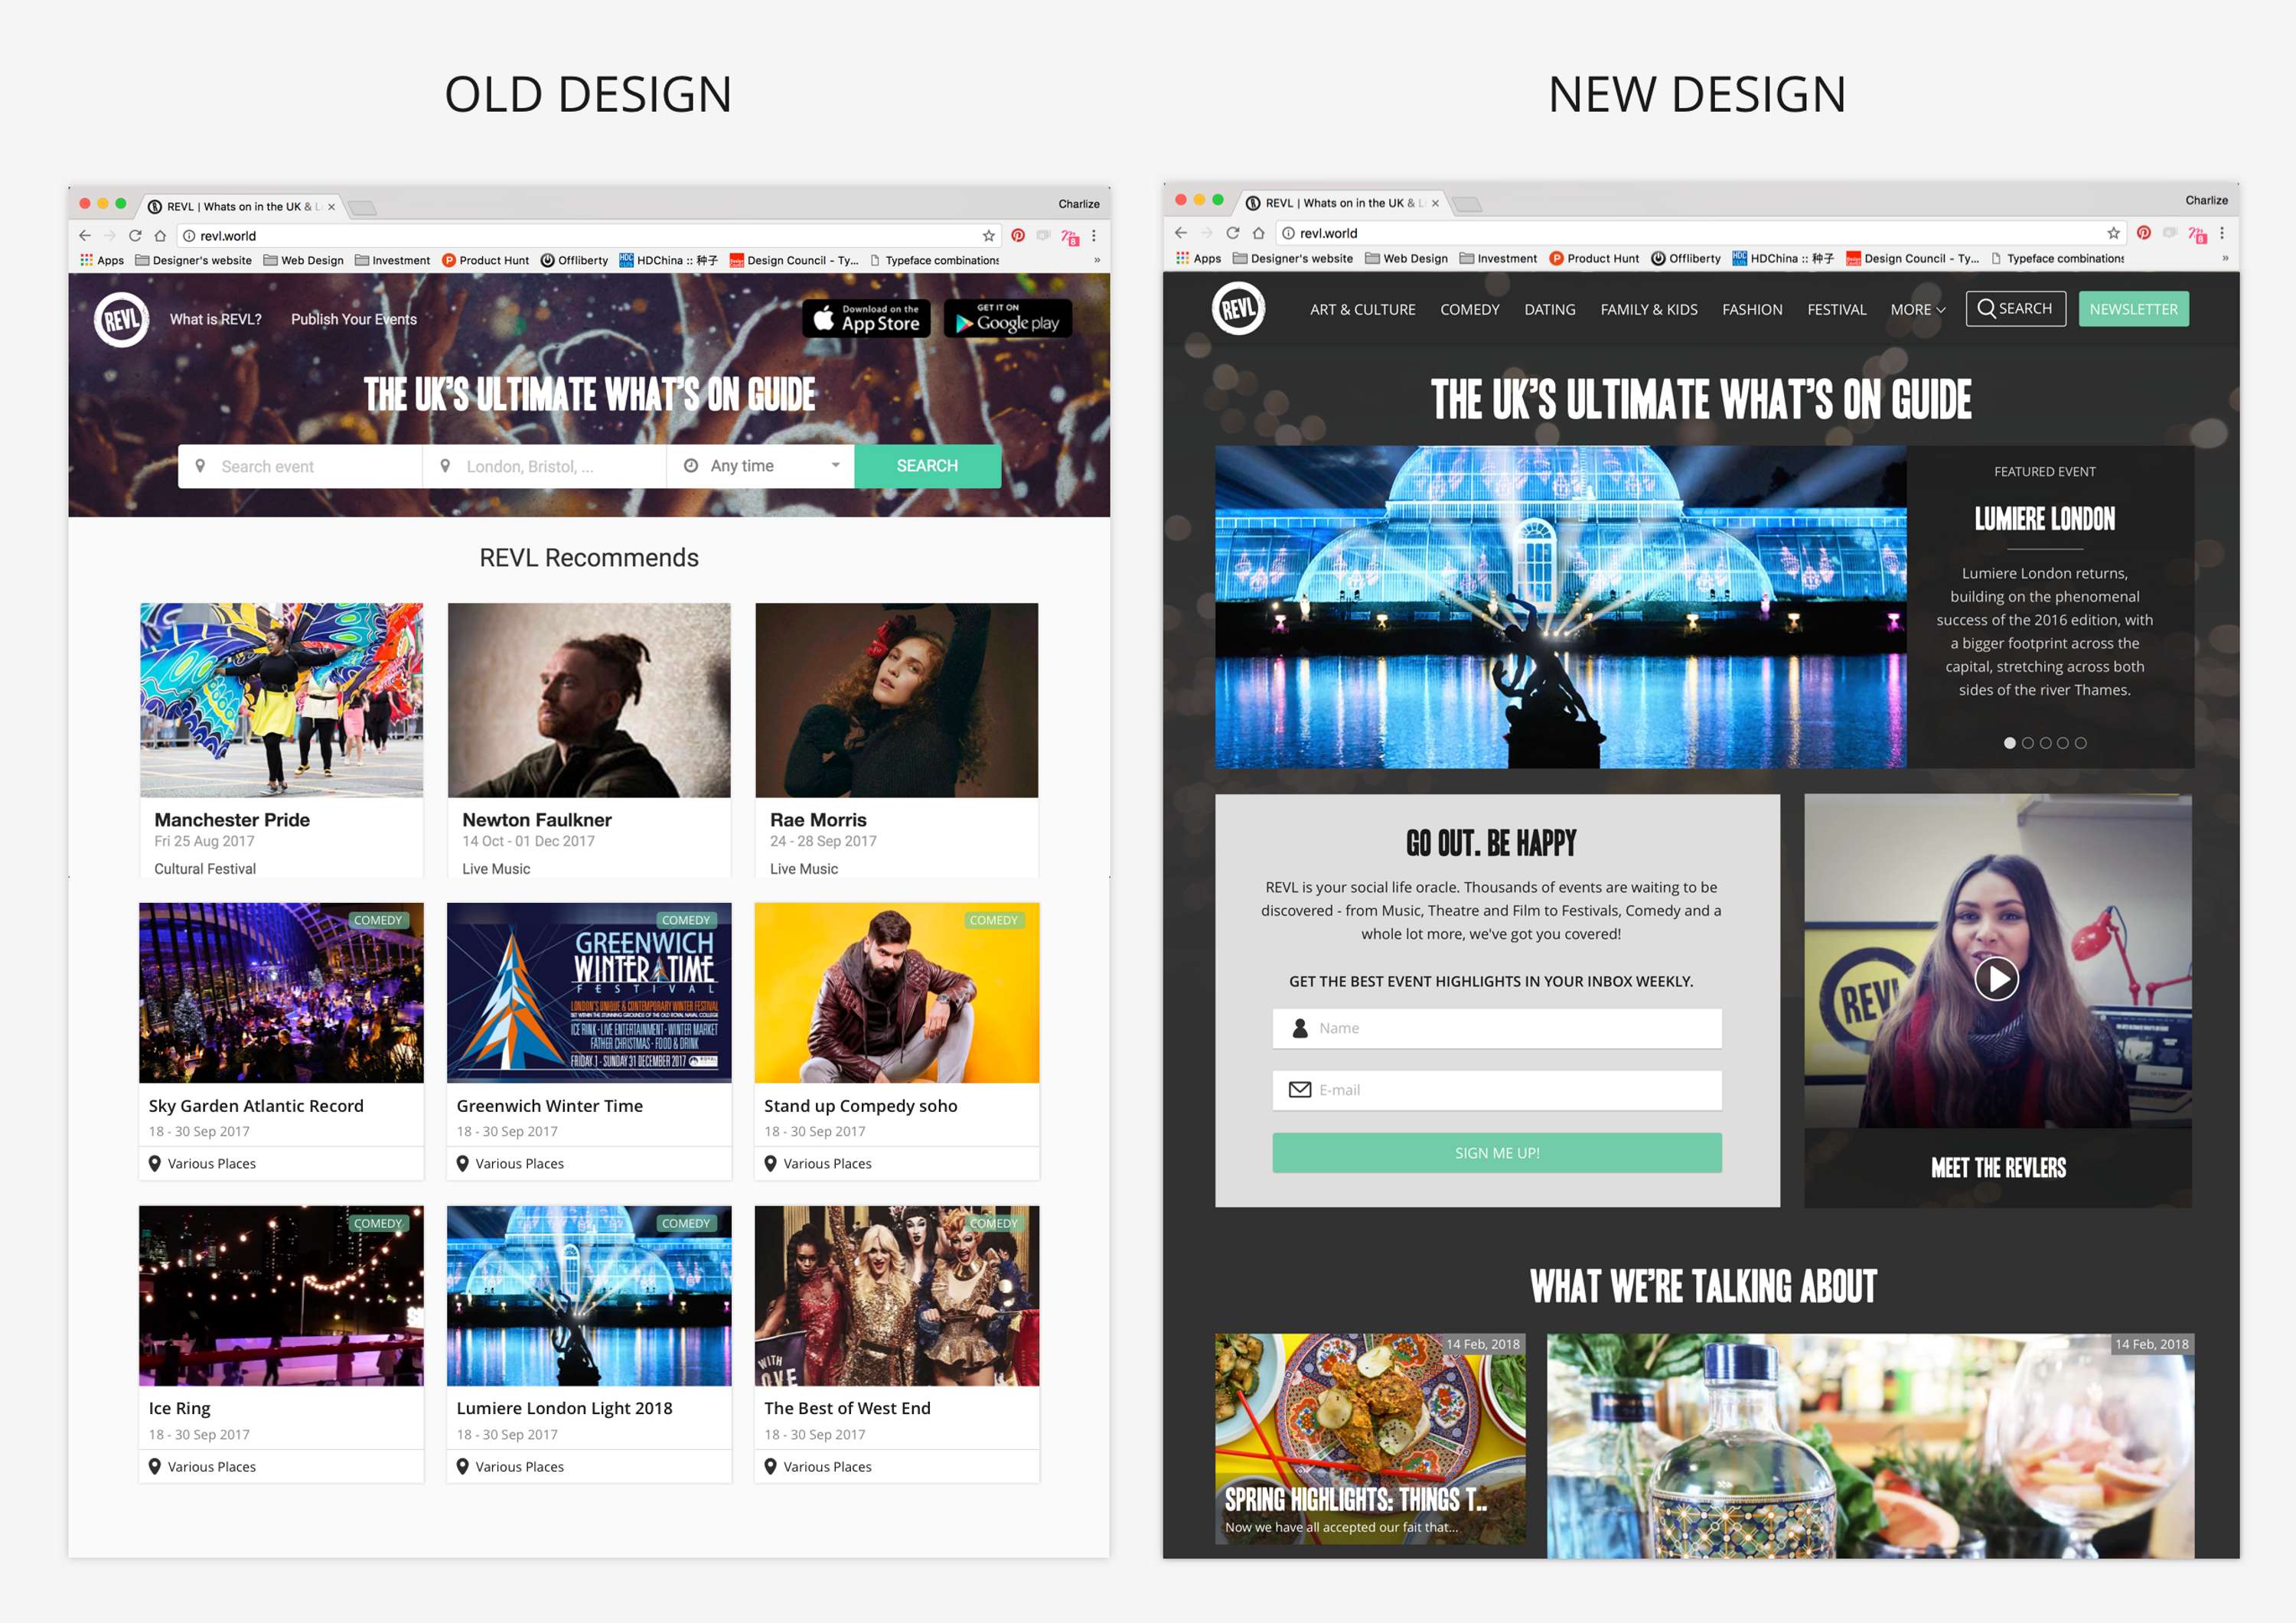
REVL is the UK's largest aggregator of event information platform, with the mission of becoming the ultimate 'What's On' guide for the millennials. When I joined in late 2017, the website had originally been put together using react UI components as a quick experiment to see how Google index web pages with scraped data. More than 90% of our traffic comes through google search, so SEO optimisation was the main focus of our web strategy.


RESTRUCTURING SITE NAVIGATION

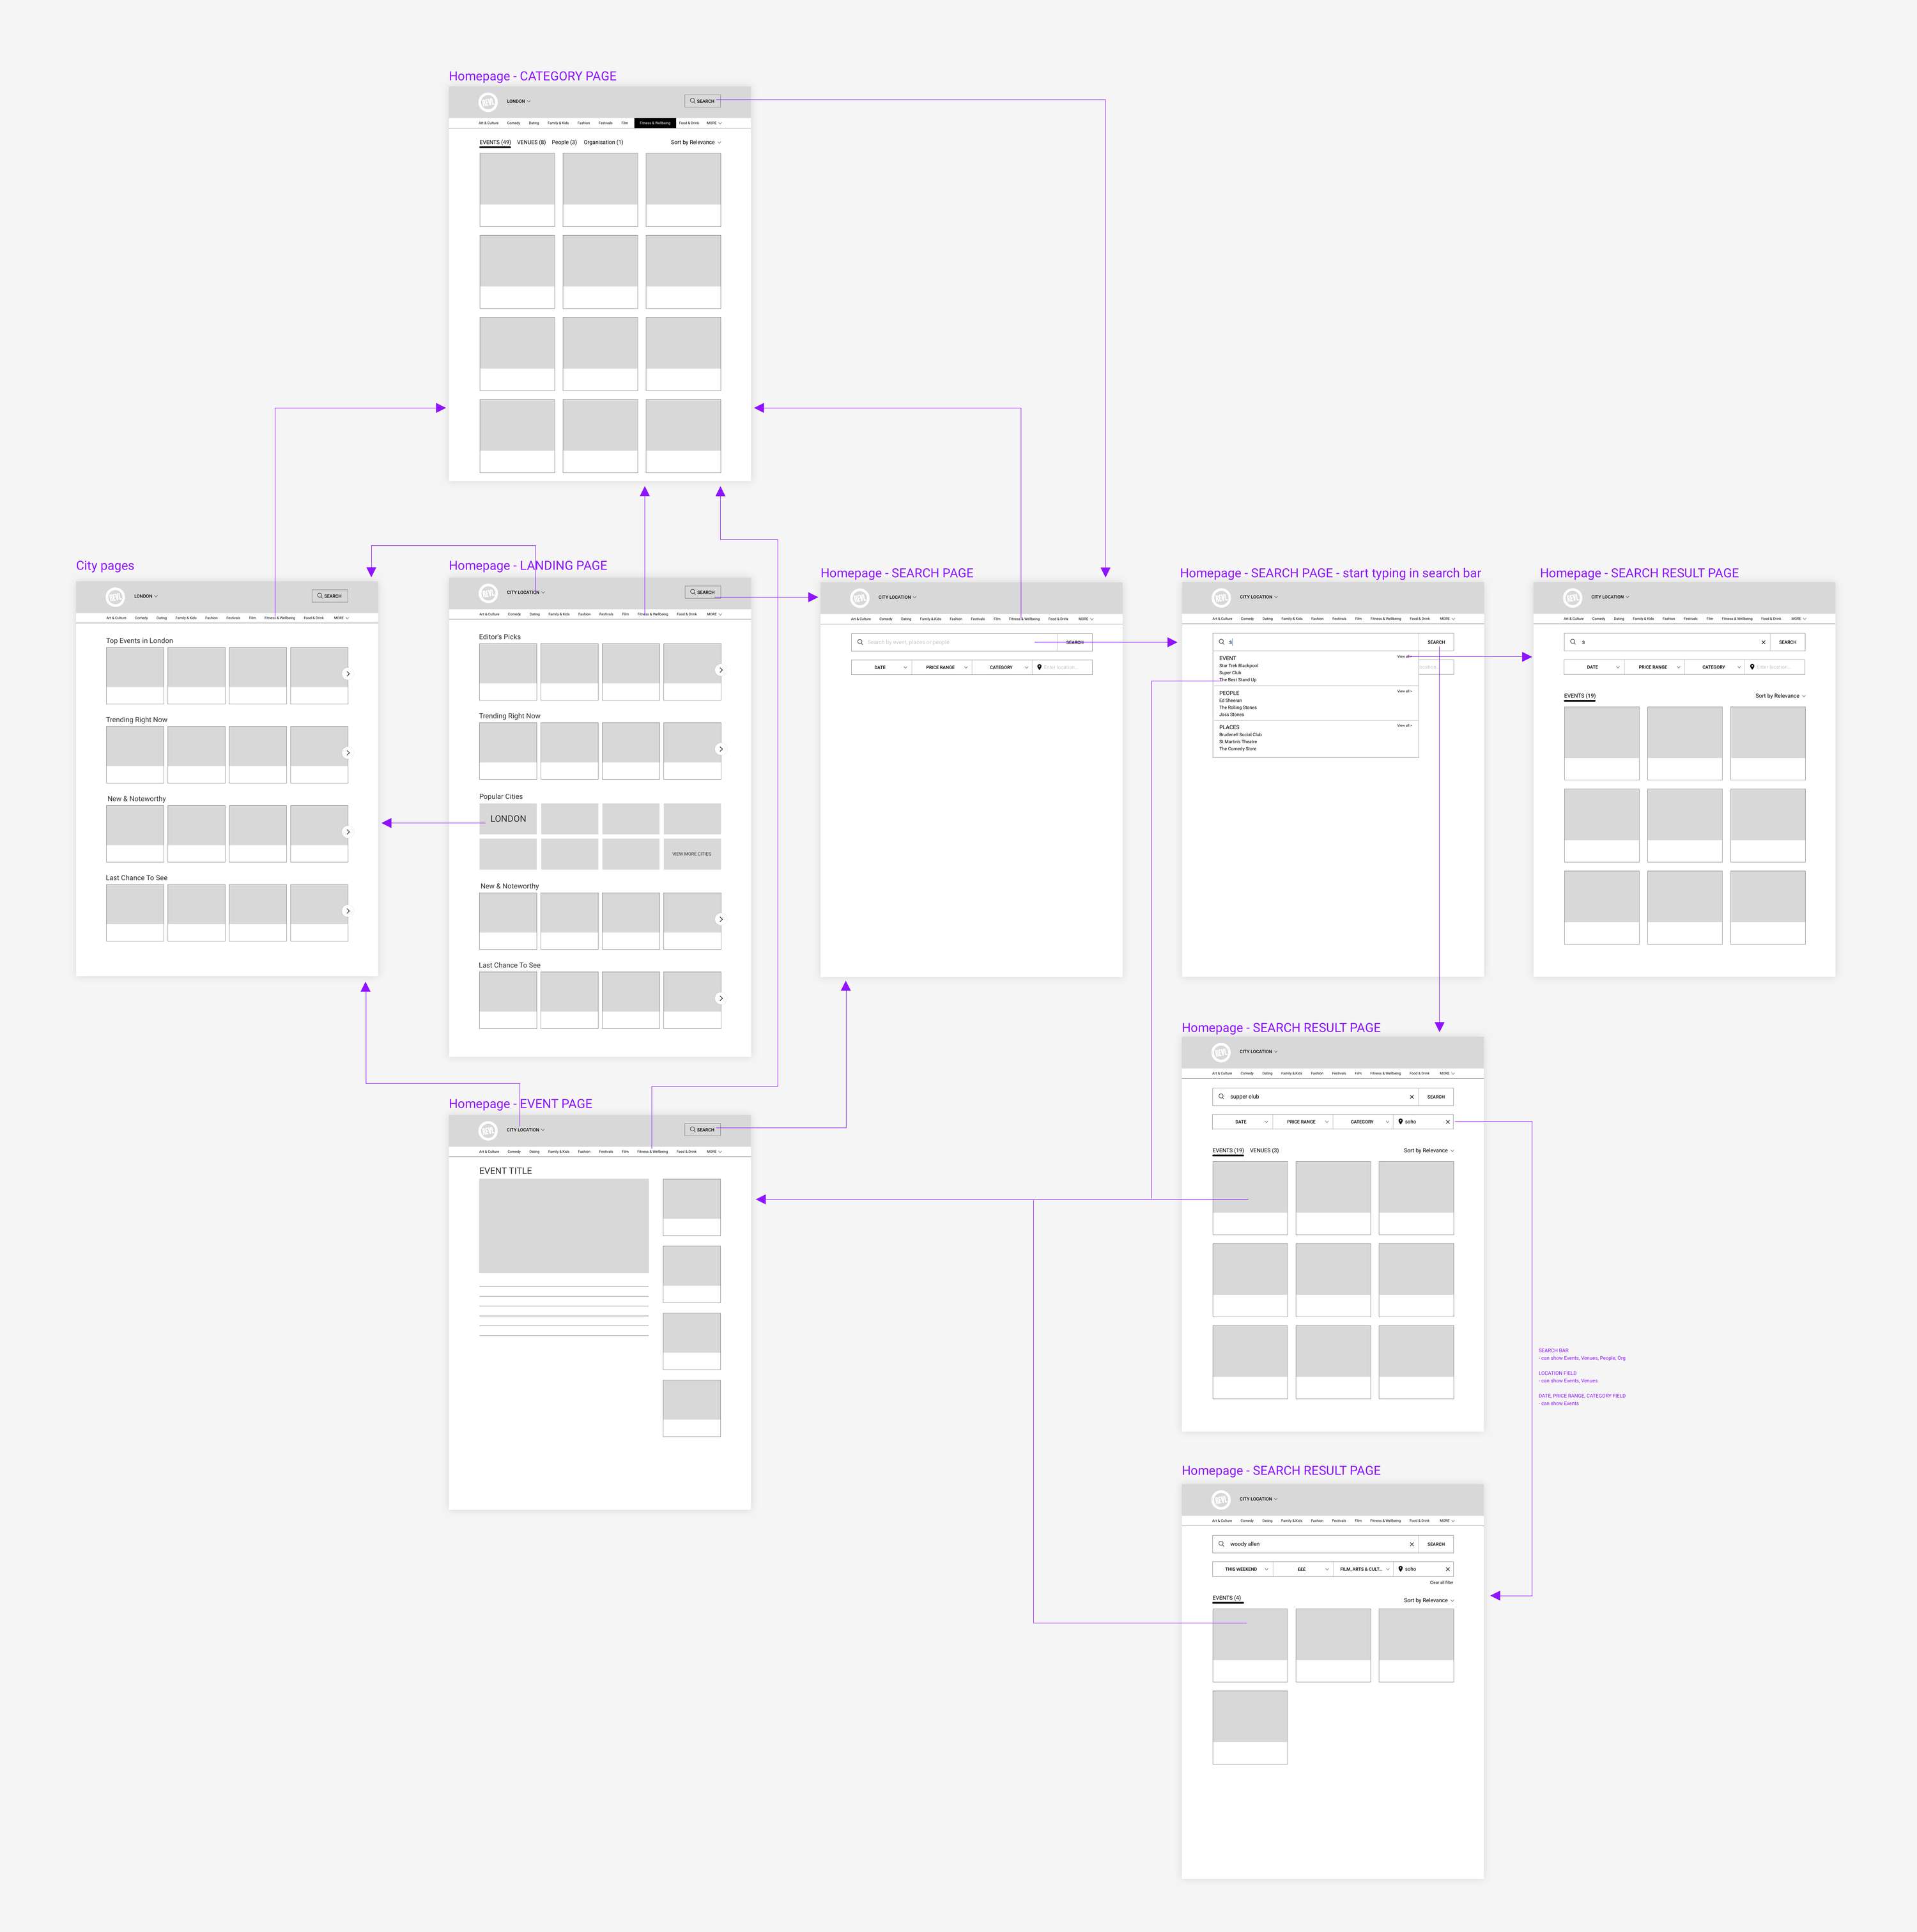
Having a structured navigation was one of the main part of the SEO initiatives to drive web traffic to our site. The web pages were submitted as 'structured data' to Google (thereby improving its ability to list our page). This is the high level user flow for the navigation restructuring:
As most of REVL's content is scraped data, it was crucial that we introduce landing pages on the site that combine the very popular combination of event category (the "what") and location (the "where"), so that we can been seen as providing value to users and be ranked higher by Google at indexing pages for search. As shown below, we introduced a list of event categories pages in the main menu, whilst moving the search bar to its own separate page. 

UNIQUE CONTENT STRATEGY

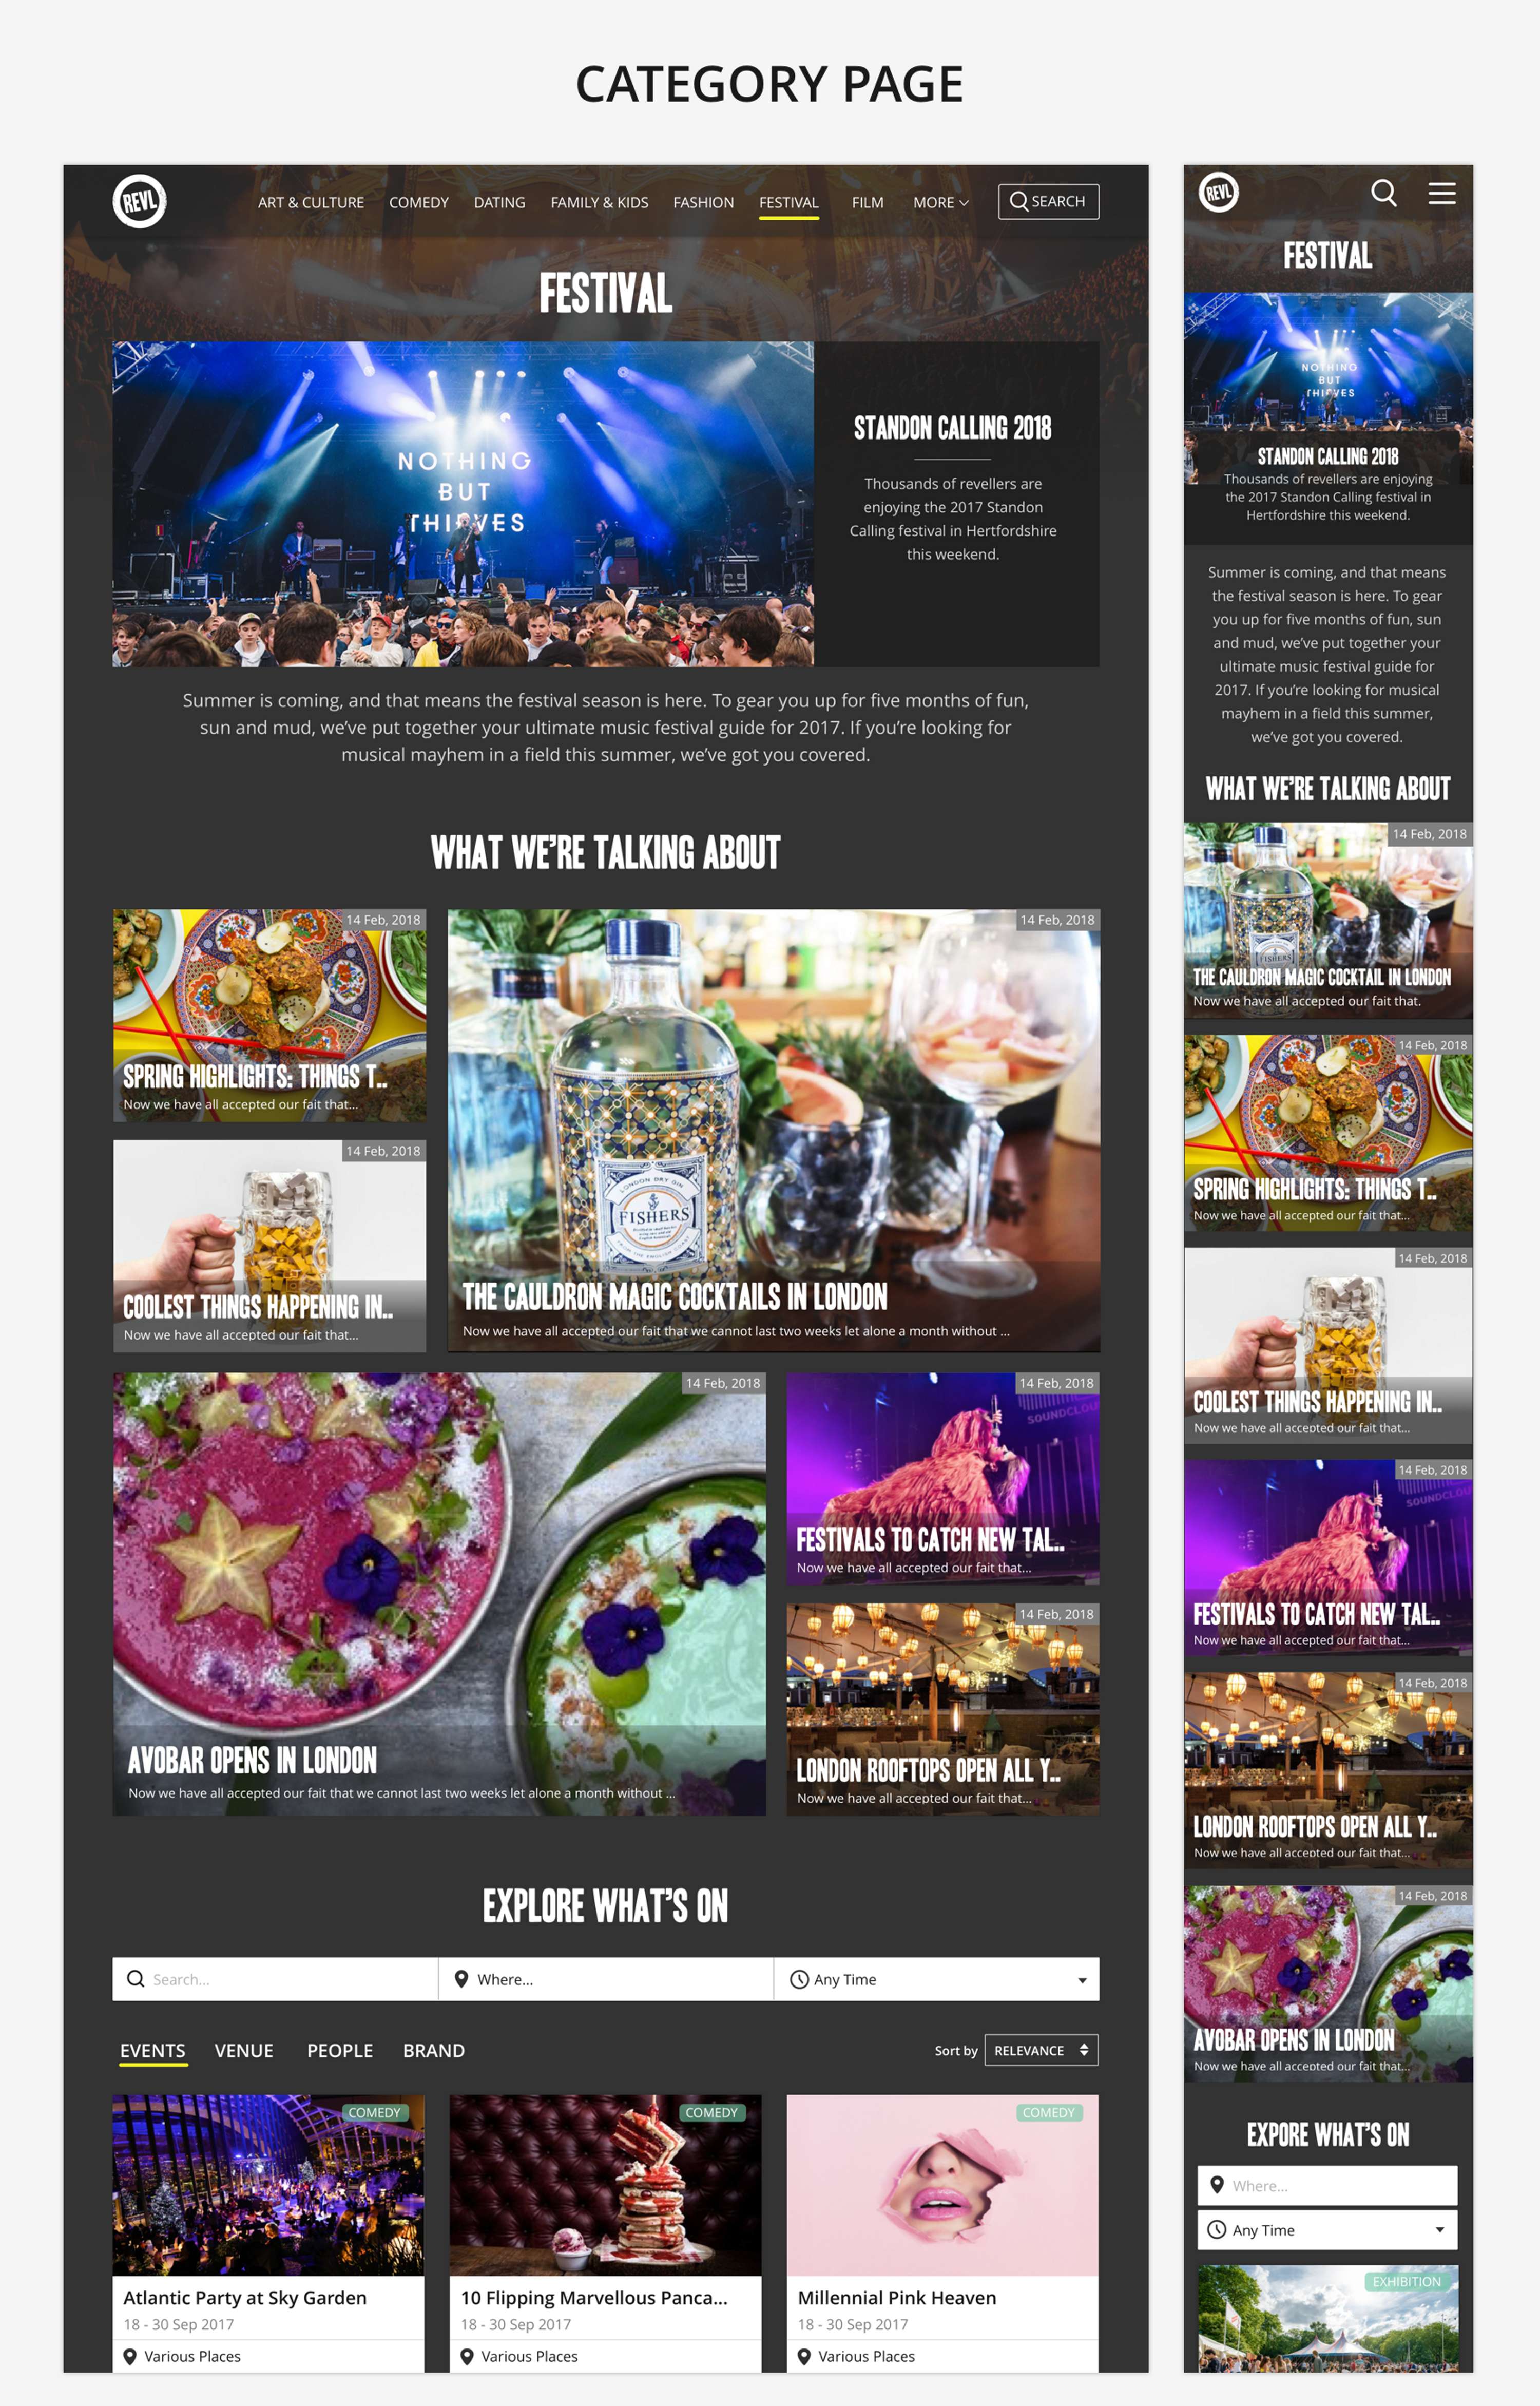
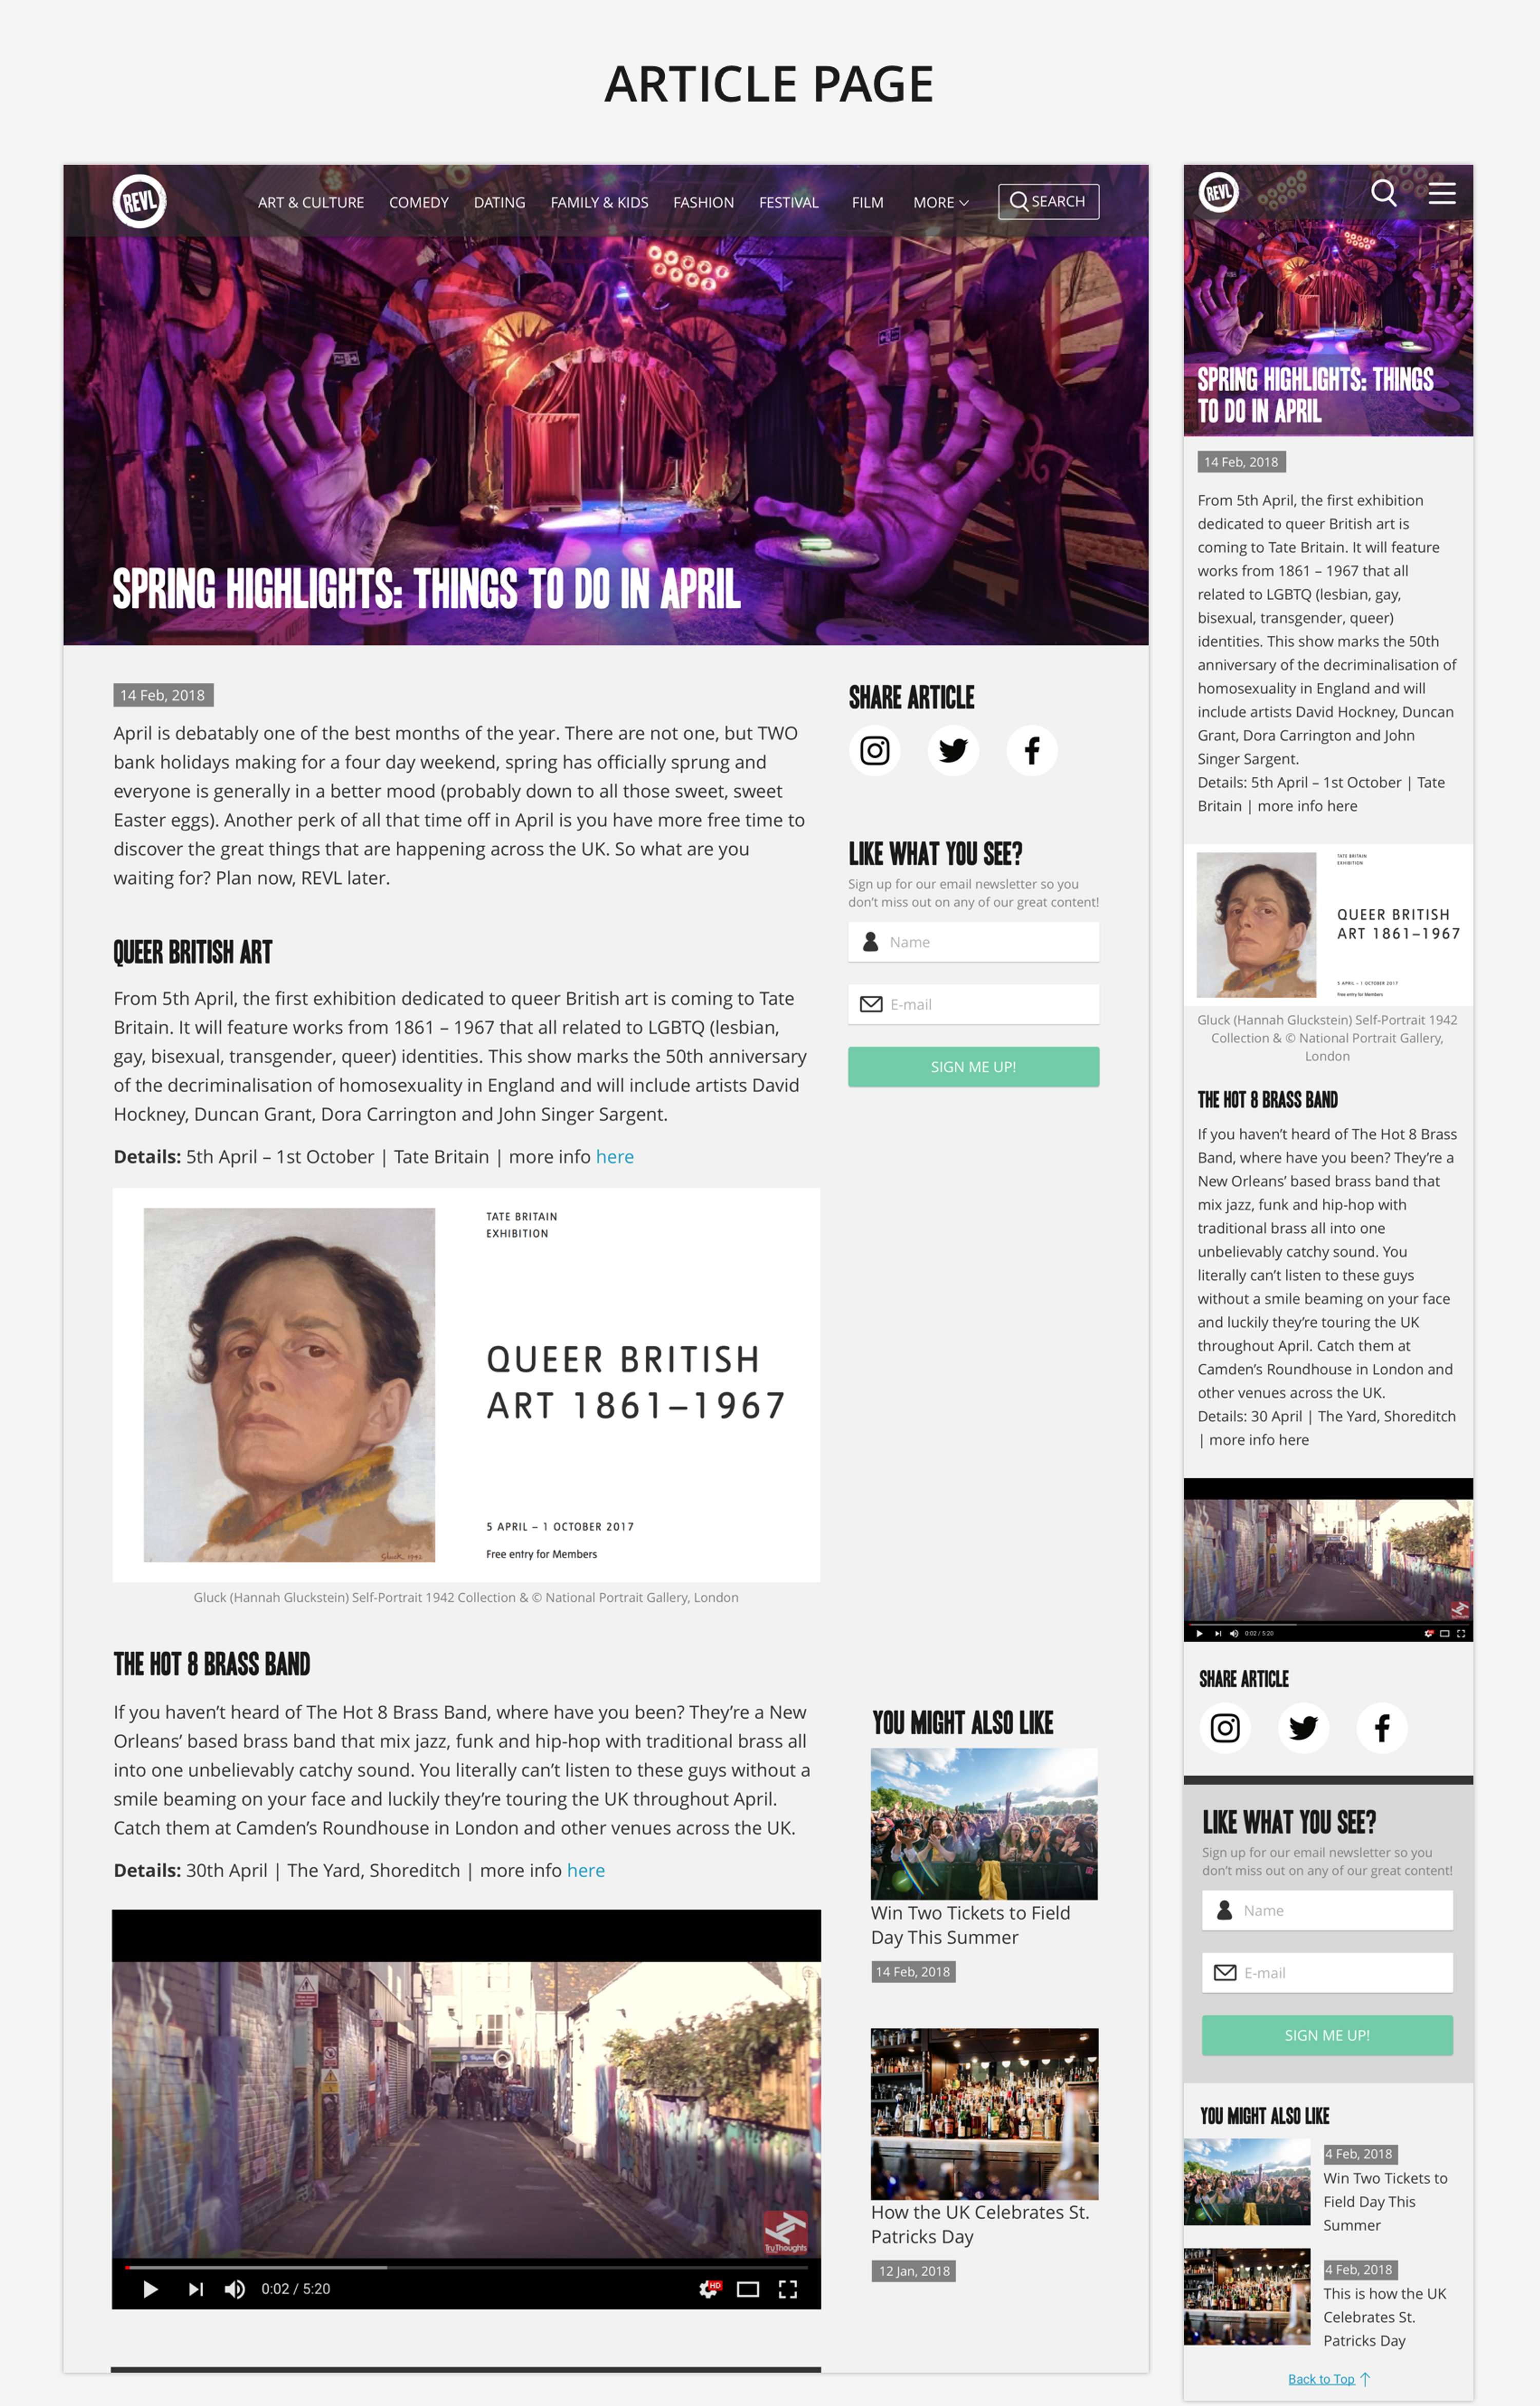
As we as restructuring the navigation, we integrated the site with CMS tools for editorial curation as well as publishing unique content on Category/City landing pages, as well as writing blog articles, producing video content and choosing featured events all of which would be regarded as meaningful content by Google. Through Analytics we know that 85% of the traffic are on mobile, so we took the mobile-first approach to the site. 

DATA DRIVEN DESIGN

Over 90% of our traffic comes through Google search and those users land straight on the event page. It is therefore crucial that users are able to purchase event tickets successfully if that's what they've come to the site for. Designing the ticket component for REVL wasn't straightforward, as the website has over 50K events and which contains a variety of different cases. I worked closely with the data team to learn about our data. And the key insights I gathered were: 

  • In total, the data set contains 53625 events, 32% of which have been viewed at least once and 29% of which have one or more ticket. In other words, 70% of the events actually do not have tickets.

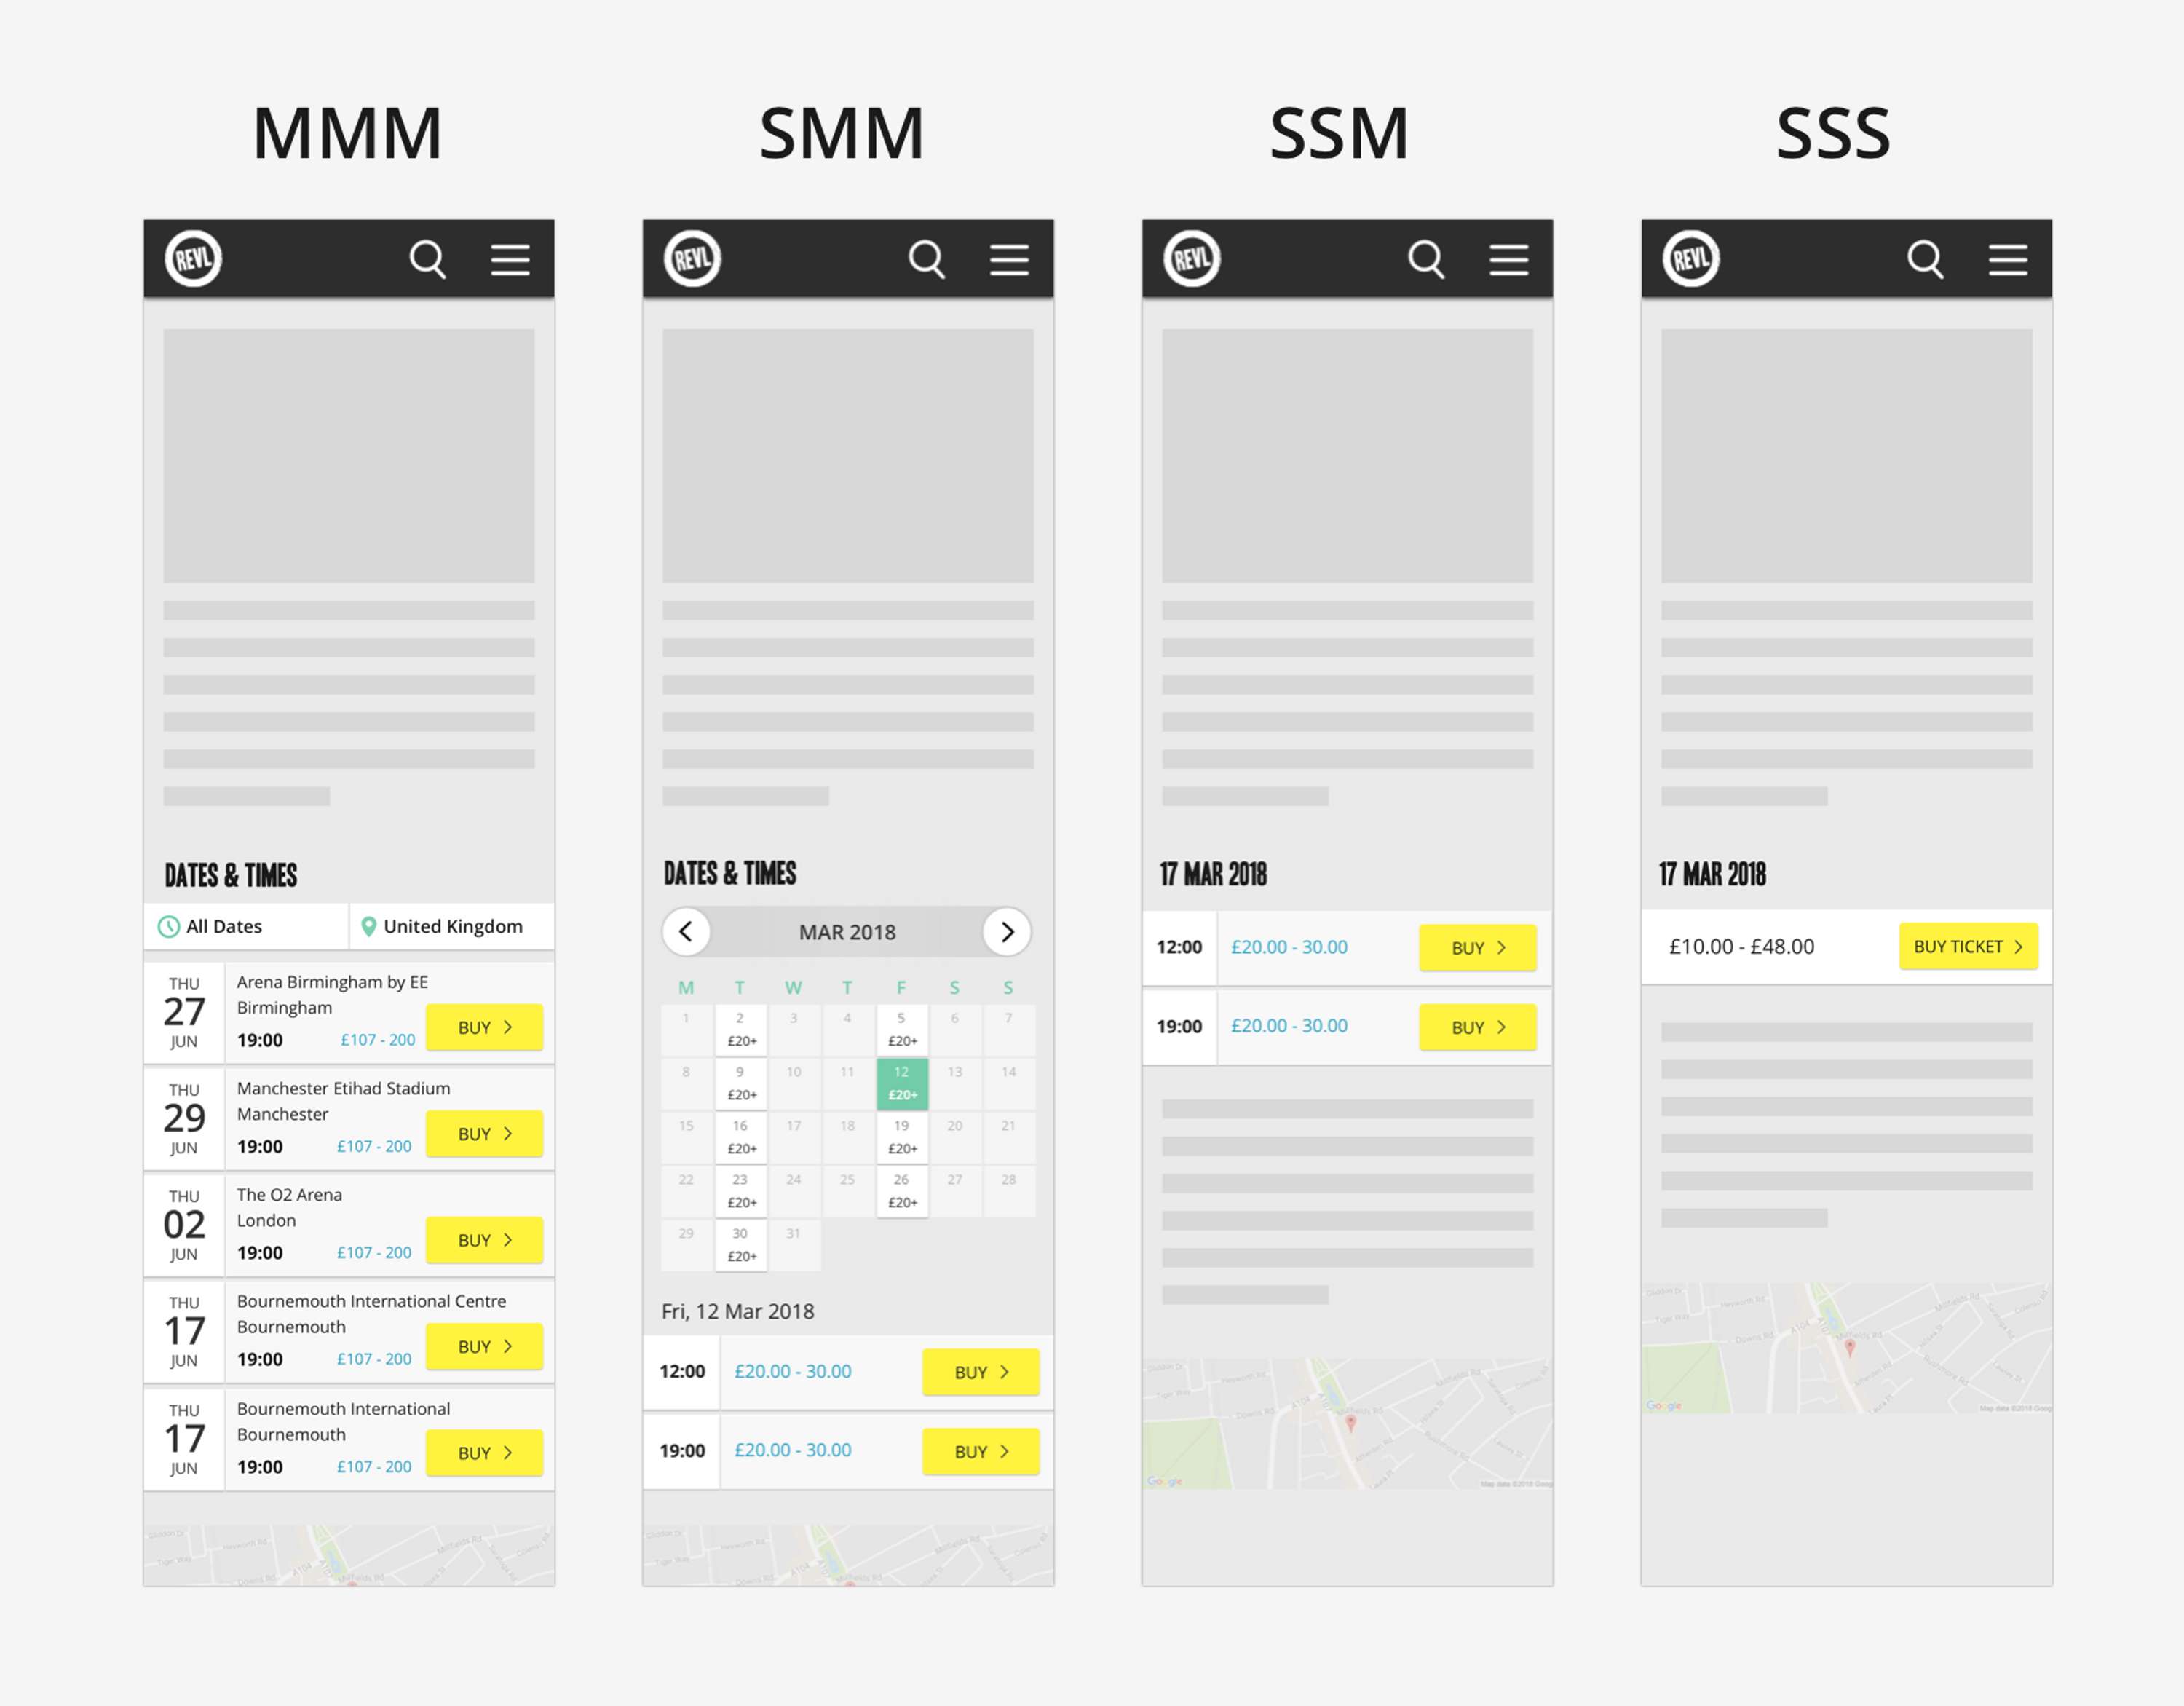
  • Every event has the properties of a 'Venue', a 'Date' & a 'Time'. This gives possibilities of the following 5 combinations to consider as I define the scope: 

  1. An event can be on a Single Venue, Single Date, Single Time (SSS)
  2. An event can be on a Single Venue, Single Date, Multi Times (SSM)
  3. An event can be on a Single Venue, Multi Dates, Multi Times (SMM)
  4. An event can be on a Multi Venue, Single Date, Multi Times (MSM)
  5. An event can be on a Multi Venues, Multi Dates, Multi Times (MMM)
Based on that insight, starting with mobile I wireframed each cases with the exception of MSM, as it's an edge case & only happens in 0.2% of all events.  
MMM - An example of this would be the Lumiere London Light Show, which happened at multiple venue across London on different dates & time. This is the only case in the event sets where the 'location' and 'date & time' are not fixed, which means the list of results for the random combination of those 3 properties could be really long and, thus, user must be able to filter the when and where. (See above the left image in the wireframe)
SMM & SSM - An example of this would be an exhibition type of event or a weekly course for a period of time. As the venue information is fixed, and user is only interested in finding out the 'when' here, it makes sense to use a calendar component to surface all the relevant time-related information at a glance.
SSS - In the majority of the cases, events are one-off and don't happen again at a different venue or time. So CTA should be really clear - 'BUY TICKET' - by removing any unnecessary UI. For example, showing a calendar or a filter bar would only cause additional visual noise.

THE RESULT

As a result of the SEO and the site re-design, overall we significantly reduced the bounce rate by around 70% and steadily increased the monthly active user (MAU) since the start of the project in November 2017, as the Google Analytics shows (image below).

Companies

  • REVL logo

    REVL

    • Technology

Skills